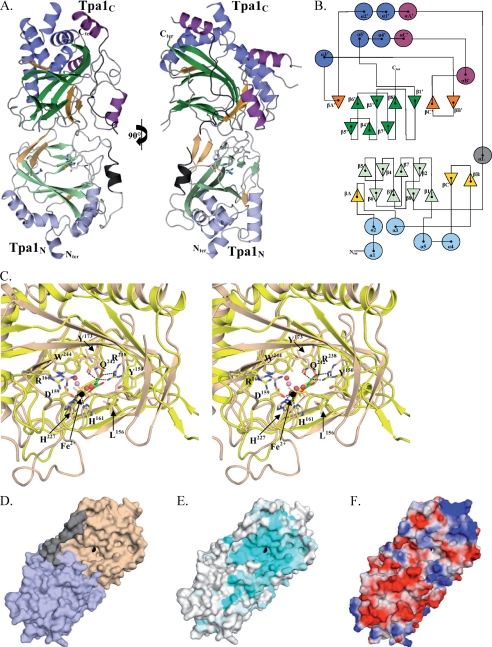
FIGURE 1.
S. cerevisiae Tpa1 structure. A, a ribbon representation of the Tpa1 protein is shown. B, a topology diagram is shown. The same color code as in panel A is used. C, a stereo view of Tpa1N active site (light brown) superposed on PHD2cat (yellow) is shown. The 2OG co-substrate has been modeled into the active site cavity by superposing the structure of a DSBH protein obtained in the presence of 2OG onto the Tpa1N domain. Black and red spheres depict the iron atom and water molecules observed in the crystal structure, respectively. D, a surface representation of the Tpa1 protein is shown.. Tpa1N (wheat) and Tpa1C (slate) are joined by a linker (gray). The iron atom is represented as a black sphere. E, a surface representation of residue conservation mapped at the surface of Tpa1 is shown. Coloring is from blue (highly conserved) to gray (low conservation). F, representation of electrostatic potential at the Tpa1 surface is shown.

