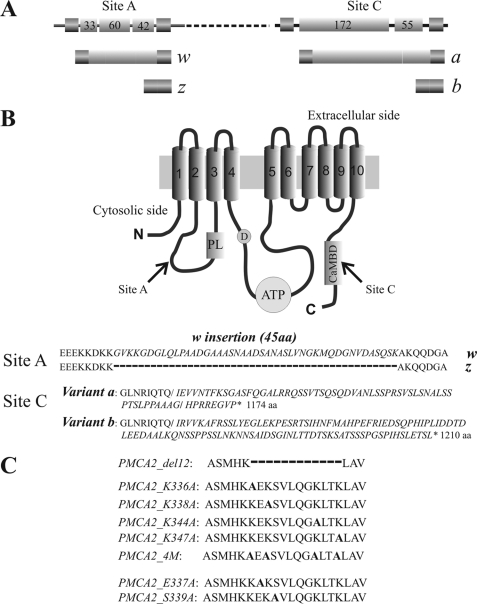
FIGURE 1.
A, linear representation of the alternative splicing options at site A and site C of the PMCA2 transcript. Exons are indicated by shadow boxes and introns by the black line. The numbers in the boxes represent the nucleotide number of each exon. B, topography model of the plasma membrane Ca2+-ATPase and sequences of alternative splicing products of isoform 2. The 10 putative transmembrane domains are numbered and indicated by shadow boxes. PL indicates the phospholipid binding domain downstream of site A of alternative splicing; D indicates the catalytic aspartate; ATP and CaMBD indicate the ATP-binding site and the calmodulin binding domain, which contains site C of alternative splicing. C, sequences of the PMCA2 region that have been mutated or deleted in the constructs used in this study. The alanine that replaces the mutated residue in the different constructs is indicated in bold. The dashed line represents the 12 amino acids deletion.

