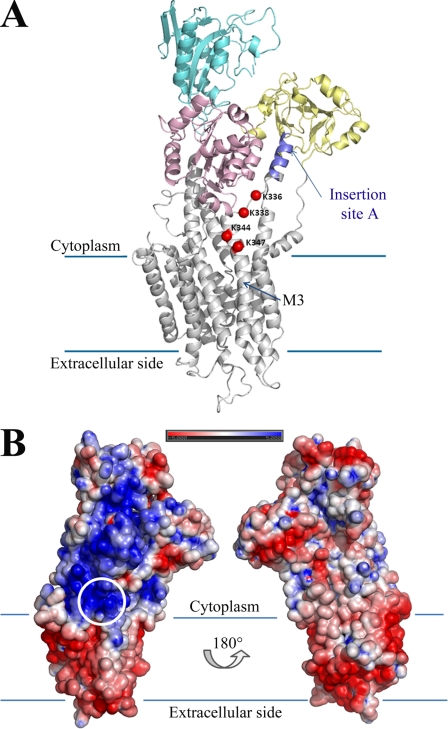
FIGURE 8.
A, overview of the PMCA2 model, shown in schematics and color-coded for the different canonical domains, with the four mutated lysines highlighted as red spheres. The approximate location of the membrane limits are shown with lines, and the third transmembrane helix is labeled as M3. Note that the C-terminal part of PMCA2 from residue 1088 onward could not be modeled. Insertion site A is highlighted. B, electrostatic potential of the PMCA2 accessible surface. The structure is shown in the same orientation as in A and rotated around the central axis (right). The location of the mutated lysine residues is circled. Note how the area around and between the four lysines and insertion site A is the only PMCA2 region with positive potential in contact with the membrane.

