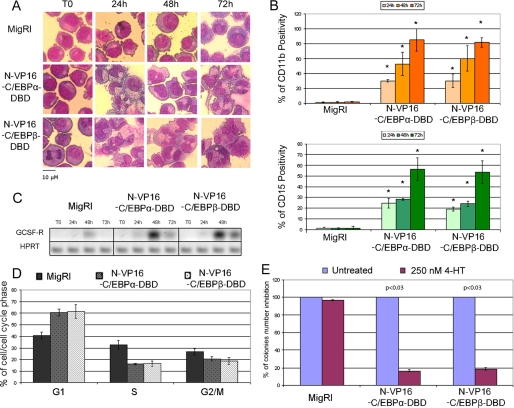
FIGURE 5.
Effect of VP16-C/EBP-DBD chimeric proteins on proliferation and differentiation of K562 cells. A, morphology is shown. Light microscopy images of May-Grünwald-stained untreated or 4-HT-treated MigRI-transduced or VP16-C/EBP-DBD-expressing K562 cells are shown; original magnification −40. B, CD11b (upper panel) and CD15 (lower panel) expression was detected by flow cytometry with phycoerythrin-conjugated monoclonal antibodies (Pharmingen). Values represent the mean ± S.D. of three independent experiments. *, p < 0.03 relative to MigRI transduced K562 cells. C, GCSF-R expression was assessed by semiquantitative RT-PCR. HPRT expression was used as internal loading control. Results are representative of two independent experiments. D, cell cycle distribution (DNA content analysis of propidium iodide-stained nuclei) of 4-HT-treated (72 h) K562 cells is shown. Values represent the mean ± S.D. of three independent experiments. E, shown is a colony formation assay of 4-HT-treated MigRI- or VP16-C/EBP-DBD-ER-transduced K562 cells. Values (mean ± S.D. of two independent experiments performed in duplicate) are expressed as the percent of colonies of 4-HT-treated versus untreated cells taken as 100%. p values indicate statistical significance of the difference in colony number of untreated MigRI- or VP16-C/EBP-DBD-ER-transduced K562 cells versus 4-HT treated calculated using unpaired, two-tailed Student's t test.

