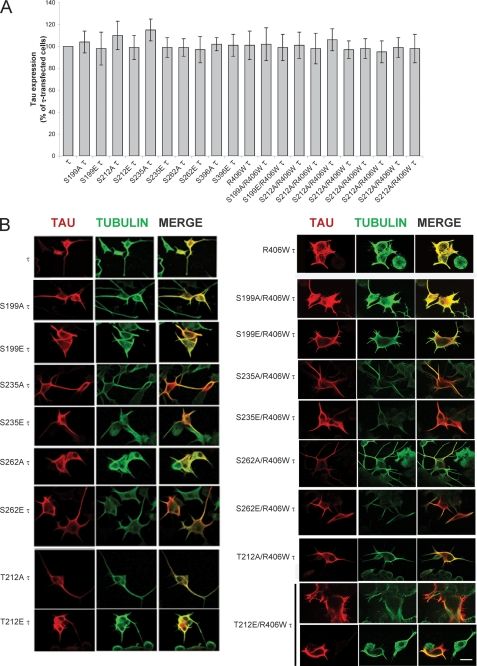
FIGURE 2.
Expression of single-site pseudophosphorylated Tau (1E Tau and 1E R406W Tau) in PC12 cells. A, the levels of Tau (τ) expression in the cells was measured by quantifying the immunofluorescence of Tau relative to that of tubulin, using ImageJ software. The ratio of Tau to tubulin was considered 100% for cells transfected with wild type Tau. Error bars, SD. B, PC12 cells were transfected with pseudophosphorylated Tau for 24–48 h, and its expression was studied by immunocytochemistry as described. The cells were double labeled with 134d (Tau, red fluorescence) and DM1A (tubulin, green fluorescence). Merge is shown in yellow. Bar, 25 μm.

