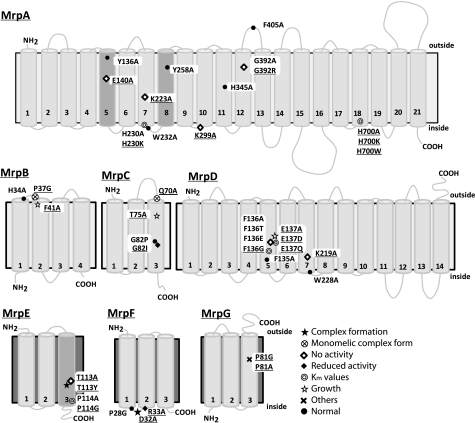
FIGURE 1.
Transmembrane topology of Mrp proteins and positions of mutations induced in this study. Transmembrane segments were predicted by ConPred II, HMMTOP, and TMHMM (available on the World Wide Web) were used in the analyses of the secondary structure predictions for each Mrp subunit. Light gray transmembrane segments were predicted by all algorithms. Dark gray shading in MrpA indicates transmembrane segments that were predicted by only two of the algorithms (HMMTOP and TMHMM). Dark gray shading in MrpE indicates transmembrane segments that were predicted by only ConPred II. Underlined mutations indicate positions at which a mutation produced a phenotype that differed from wild-type Mrp. ●, positions at which the mutations complemented an antiporter-deficient E. coli KNabc transformant and exhibited normal Na+/H+ antiport activity; *, mutations that affected the level of Mrp proteins in the membrane; ♢, mutations that led to loss of the Na+/H+ antiport activity and loss of Na+ tolerance; ♦, mutations that decreased the Na+/H+ antiport activity, without an effect on growth of the E. coli transformant;  , mutations that affected the Km values of Mrp-dependent antiport activity;
  , mutations that affected transformant cell growth; ⊗, mutations that affected Mrp complex formation; ×, the two mutants in MrpG-P81 that had a unique phenotype.

