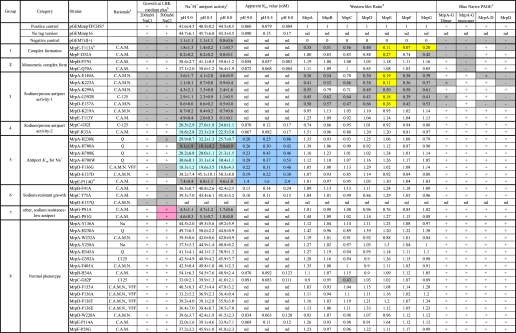
TABLE 1.
Summary of growth, antiport activity, membrane expression level, and complex formation of each mutation and positive and negative controls
a C.A.M., conserved across Mrps; C.A.M.N., conserved across MrpA, MrpD, NuoL, NuoM, and NuoN; Q, hypothesized quinone-binding site, partial LXXXH motif (35–37); VFF, Na+-binding motif (34); Na+, proposed Na+-binding residue (38).
b Data from Morino et al. (22).
c Details of the methods for preparation and assays of membrane vesicles are described under “Experimental Procedures.” The values presented for the percentage dequenching are average values from duplicate assays from three independent experiments. These values for percentage dequenching are shown with the S.D. values.
d A quantitative imaging system, Pluor-S MAX (Bio-Rad), was used for detection and analysis of a chemiluminescence image. Values in the table indicate the ratio of expression level of each Mrp protein calculated by comparing with that of pGEMmrp THCHS7.
e The clear presence of multiple Mrp proteins at hetero-oligomer positions is scored as a “+” in the MrpA–MrpG dimer or monomer column even if one or more other Mrp proteins is not well resolved. Dark gray highlights indicate mutant phenotypes that differ markedly from the wild-type transformant (e.g. inability to grow in the presence of 200 or 500 mm added NaCl, major defects in Na+/H+ antiporter activity, decreases in the membrane levels of Mrp proteins of ≥70%, or absence of one or more Mrp complexes in BN-PAGE analyses. Mutants in which the Na+/H+ antiporter activity is at least 25% lower than wild type are highlighted in light blue. Mutants in which the apparent Km is at least 2.5 higher than that of wild-type Mrp are highlighted in dark blue. Mutants in which the expression level of Mrp proteins in membrane vesicles is ≤30% of the positive control are highlighted in yellow. nd, not determined (see “Experimental Procedures” for the criteria for which assays were omitted).

