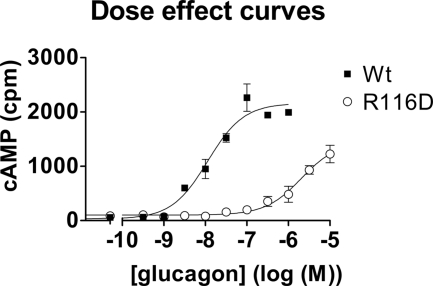
FIGURE 3.
Comparison of glucagon dose-effect curves on HEK 293-T cells transfected with the “wild type” glucagon receptor (closed squares) or with the R116D mutant (open circles). The pEC50 values in this experiment were 7.89 ± 0.09 and 5.39 ± 0.05. Results shown are representative of three experiments. Error bars, S.E.

