FIGURE 10.
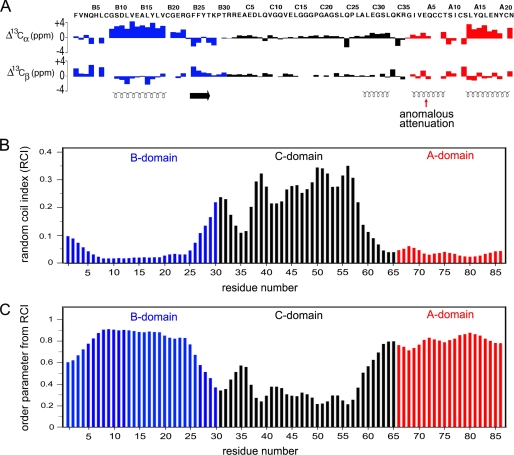
13C NMR chemical-shift index of proinsulin and predicted protein dynamics. A, 13C NMR chemical shift index (CSI) values of B-domain (blue), C-domain (black), and A-domain (red): upper and lower panels pertain to 13Cα and 13Cβ secondary chemical shifts. Data pertain to an engineered proinsulin monomer at neutral pH as described (26). Helical segments are indicated by spirals at the bottom; red arrow indicates the segmental attenuation of CSI values in the A1–A8 segment, presumed to reflect motions at time scales longer than nanoseconds. Horizontal arrow indicates the B24–B27 β-strand. B and C, CSI values observed in proinsulin may be interpreted in relation to a random-coil index and predicted model-free order parameters (75). B, random-coil index values were calculated based on main chain secondary chemical shifts. C, predicted main chain order parameters as inferred by random-coil index values by the method of Berjanskii and Wishart (75). These parameters pertain to putative subnanosecond fluctuations. Whereas the A domain exhibits near-uniform high order parameters, the B domain N- and C-terminal segments exhibit increasing disorder (“ramps”) at its N terminus (residues B1–B8) and BC junction (residues B25–B30).

