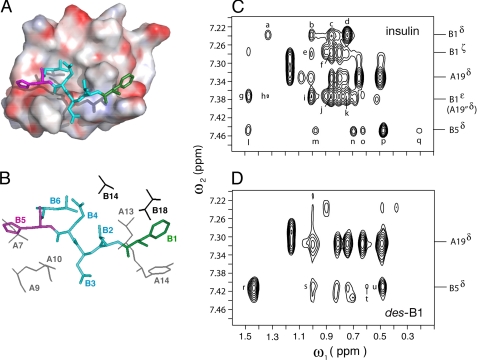
FIGURE 7.
Binding of B-chain arm within groove and diagnostic long-range NOEs. A, packing of N-terminal portion of arm (residues B1–B5) within groove of T-state structure (PDB accession code 4INS). HisB5 and PheB1 are shown in magenta (left) and green (right); intervening residues are powder blue. The molecular surface is color-coded by electrostatic potential (red, negative and blue, positive). B, corresponding stick model in which identities of neighboring side chains in groove are identified. The B1–B5 coloring is as in panel A; A- and B-chain residues are otherwise shown in gray or black, respectively. C and D, two-dimensional NMR analysis of wild-type insulin (C) and des-PheB1-insulin (D). Comparison of spectra demonstrates that contacts between the imidazole ring of HisB5 and the A-chain are retained in des-PheB1-insulin. Selected resonances positions are as labeled at right. Cross-peak assignments in panel C: a, B1 Hδ-A13 Hβ,γ; b and c, B1 Hδ-B18-Hγ1,2-CH3; d, B1 Hδ-A13 δ-CH3; e and f, B1 Hζ-B18 γ1,2-CH3; g, B1 Hϵ-B14 β-CH3; h, B1 Hϵ-A13 Hβ, Hγ; i and j, B1 Hϵ-B18 γ1,2-CH3; k, B1 Hϵ-A13 δ-CH3; l and m, B5 Hδ-A10 Hβ, Hγ1; n, B5 Hδ-B6 δ-CH3; and o–q, B5 Hδ-A10 γ′-CH3, Hγ2, and δ-CH3. D, cross-peak assignments in panel C: r-u, B5 Hδ-A10 Hβ, Hγ1, γ′-CH3 and δ-CH3. Spectra were obtained at 25 °C in 10 mm deuterioacetic acid (pH 3.0).

