Figure 2.
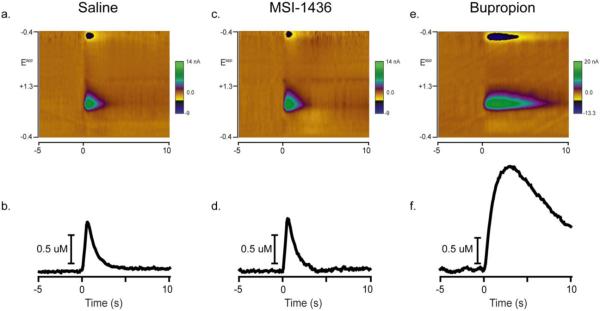
Representative examples of evoked DA release and reuptake 1hr after injection. At time 0s, a stimulation train (biphasic, 2ms/phase, 24 pulses, 60 Hz, 120 μA) is applied to the ventral tegmental area while voltammetric recordings are made for the 5s before and 10s after stimulation onset. (a.) Evoked DA release and reuptake 1hr after i.p. injection of saline. A colorplot displays all aspects of the voltammetric recording. Time is the abscissa, the electrode potential is the ordinate and current changes are encoded in color. At the onset of stimulation, current is detected at ~0.6V (green) on the positive and ~−0.2V (blue) on the negative going scan. This signature is indicative of DA (Phillips et al., 2003a). (b.) Using principal component analysis, DA concentration over time is extracted from the voltammetric data in a. (c.) Colorplot of evoked DA release and reuptake 1hr after i.p. injection of MSI-1436. (d.) DA concentration over time extracted from the voltammetric data in c. (e.) Colorplot of evoked DA release and reuptake 1hr after i.p. injection of bupropion (note the change in the colorplot scale). (f.) DA concentration over time extracted from the voltammetric data in e.

