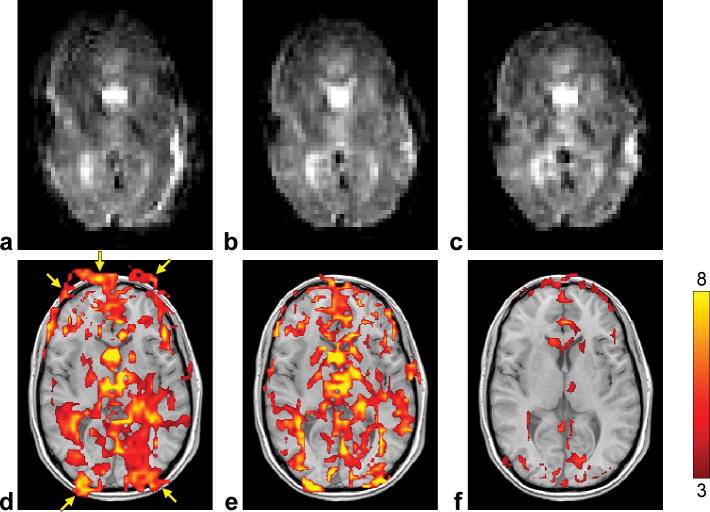
FIG. 4.
Representative images (from run 4) (a–c) and activation maps (d–f) uncorrected (left), corrected using the proposed method (KESA B0 mapping, SPHERE deblurring, and automatic residual deblurring) (middle), and corrected using a conventional method (alternating-TE B0 mapping and SPHERE deblurring) (right).

