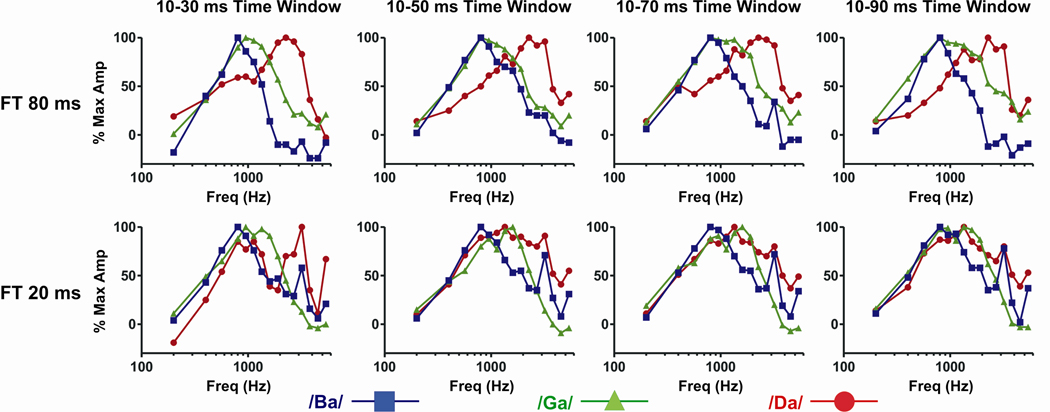
Figure 6.
Average spectral tuning curves of MUA evoked by tone responses at sites where /ba/, /ga/, or /da/ elicited the largest speech-evoked response within a given window of temporal integration (indicated at the top of each column of plots). Tuning curves for responses to the 80 ms and 20 ms formant transition syllables are shown in the top and bottom plots, respectively. Prior to averaging across sites, tone responses were binned in quarter octave steps above 800 Hz, half octave steps above 400 Hz, and a one octave step between 200 and 400 Hz. See text for details.

