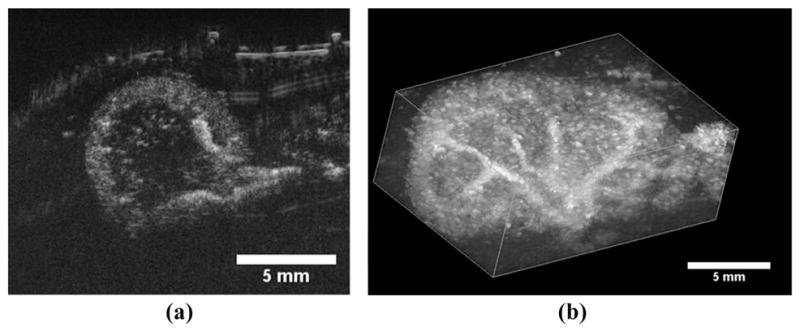
Fig. 3.

(a) A 2-D transverse slice through a rat kidney with contrast agents seen entering the volume through the large renal vasculature. (b) A 3-D maximum intensity projection through a rendered volume of sequential image slices as seen in (a). The multiple 2-D slices were acquired using a translational motor stage with step sizes of 200 μm. The images analyzed in the CTR portion of this study were identical to the cross-sectional slice seen in (a).
