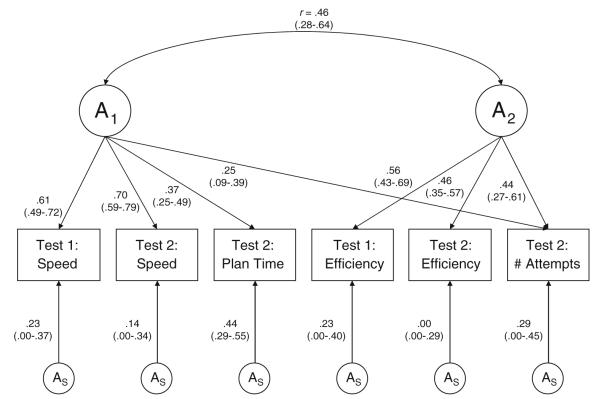
Fig. 2.
Best-fitting (most parsimonious) genetic factor model for the Tower of London A1 (speed) and A2 (efficiency) = first and second genetic factor, respectively; AS = specific genetic influences. Efficiency = % moves above the minimum. Number of attempts = number of attempts to mentally figure a puzzle. Parameter estimates and 95% confidence intervals are shown. Squaring these parameter estimates provides the contribution of each measure to the genetic variances. Arrows from A1 and A2 to the measured variables depict the factor loadings of those variables on each genetic factor. The correlation between the factors is, by definition, a genetic correlation because only genetic factors are represented in this figure

