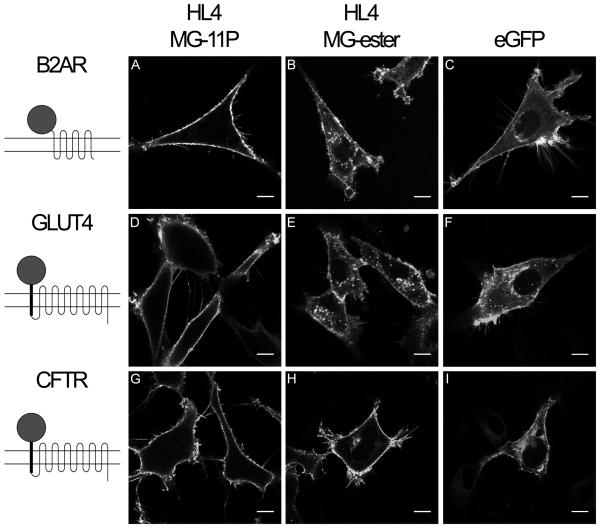
Figure 3.
Fluorescence images of HL4-MG and EGFP fusions to transmembrane proteins. Left column shows representations of fusion protein topology in the plasma membrane, where top is extracellular and bottom is intracellular. (A-C) NIH 3T3 cells expressing human β2AR with FAP or EGFP fused to the N-terminus. (D-F) C2C12 cells expressing human GLUT4 with extracellular FAP or EGFP, plus new transmembrane domain, fused to the N-terminus. (G-I) HEK 293 cells expressing CFTR with FAP or EGFP, plus new transmembrane domain, fused to the N-terminus. . (A, D, G) Cells are imaged in the presence of impermeable fluorogen, MG-11P. (B, E, H) Membrane permeant fluorogen, MG-ester, labels intracellular fusion proteins. Scale bars represent 10μm.

