Figure 2.
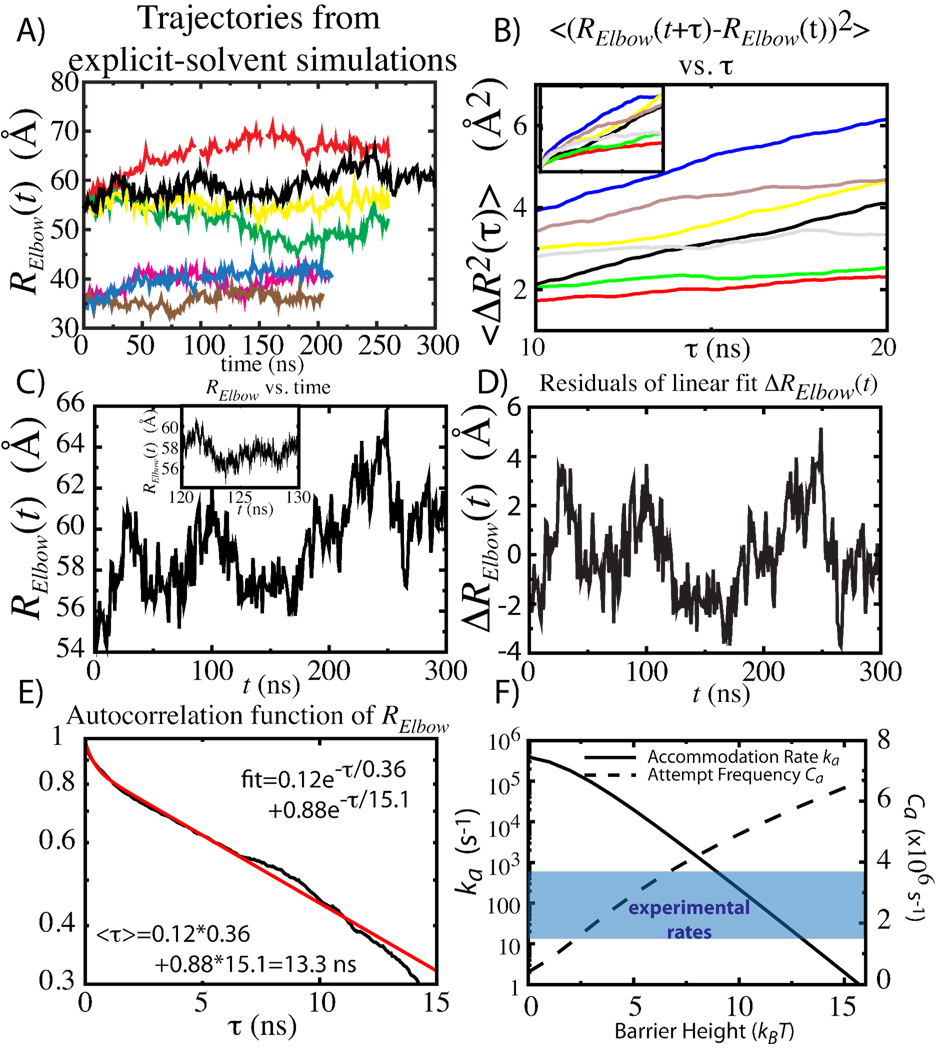
A) Time traces of Relbow from 7 explicit-solvent simulations. B) Mean-squared displacement as a function of time delay τ. DElbow waṣestimated by the slope between 10 and 20 ns. Inset shows for τ=0–30 ns. C) 300 ns trajectory, displayed at 1 ns intervals. Inset shows subset at 5 ps intervals. D) Dispersion and relaxations were calculates from the residuals of linear fit (slopes in Table 1), ΔRelbow. E) Autocorrelation function of ΔRelbow fitted to sum of 2 exponentials (SI). DElbow was calculated from the average decay time <τ>. F) Accommodation rate ka and attempt frequency Ca, for DElbow=1.1µs2/s, versus the free-energy barrier height. Range of experimentally-determined rates shaded in blue.

