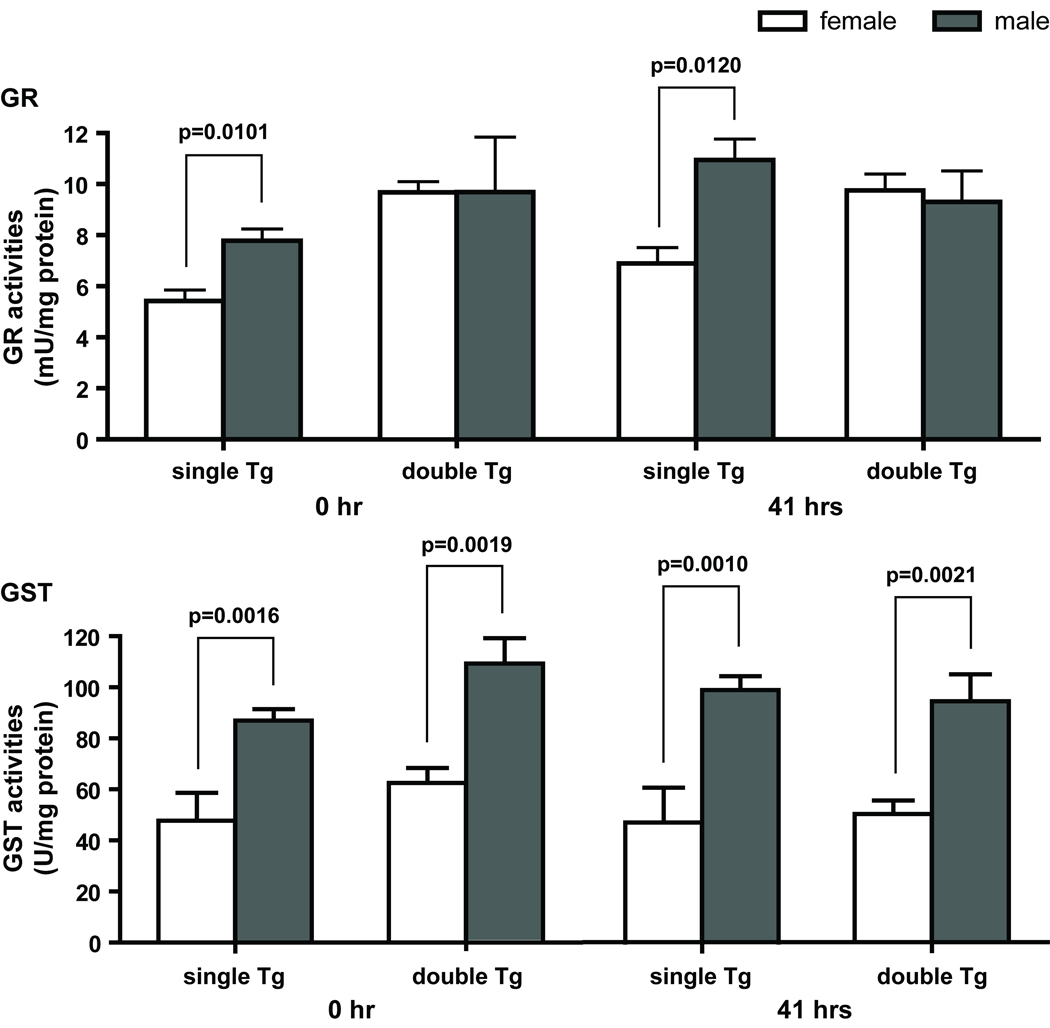
Figure 7.
Gender differences in GR and GST activities. Upper panel, significant differences in GR activities between males and females were observed in single Tg mice at both time points. GR activities in male single Tg mice were 40 and 60% higher than that in females at 0 and 41 hours, respectively. Lower panel, significant differences in GST activities between males and females were observed in single and double Tg mice at both 0 and 41 hours. On the average, GST activities in male mice were 80 to 110% higher than that in females. GR and GST are protein designations for glutathione reductase and glutathione S-transferase, respectively. Single Tg, n=14 (10 males and 4 females); double Tg, n=11 (4 males and 7 females). Mean ± SEM of specific activities are shown. Student’s t test was used for the comparison between males and females within each genotype.

