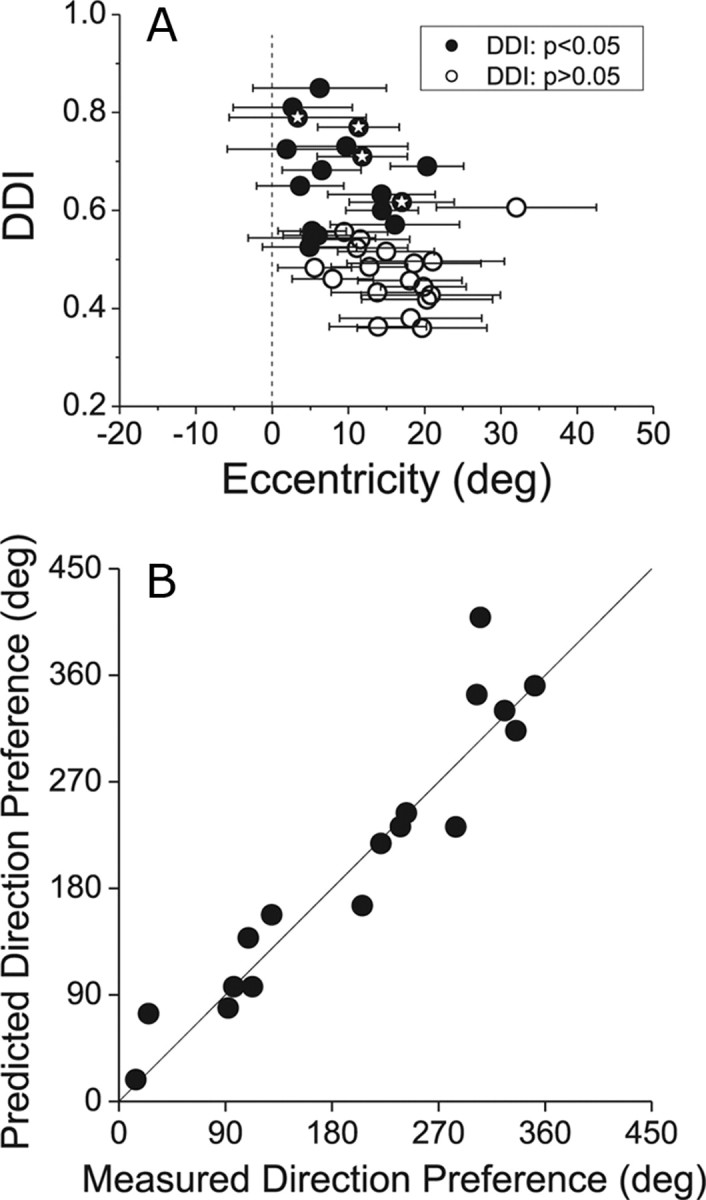
Figure 5.

A, Relationship between the strength of directional tuning in the vestibular rotation condition (using the projector) and the eccentricity of MT receptive fields. Each receptive field map, as in Figure 4, was fit with a two-dimensional Gaussian function. The eccentricity of the center of the receptive field is plotted on the abscissa, and the DDI is plotted on the ordinate. Filled symbols denote neurons with statistically significant rotation tuning (p < 0.05). Horizontal error bars represent receptive field size as ±2 SD of the Gaussian fit. Thus, the horizontal error bars contain 95% of the area of the receptive field. Symbols filled with stars indicate the 4 example neurons shown in Figure 4. B, Comparison of measured visual direction preferences with predicted preferences from vestibular rotation tuning in the projector condition. See Results for details. The strong correlation suggests that vestibular rotation tuning in the projector condition reflects visual responses to retinal slip.
