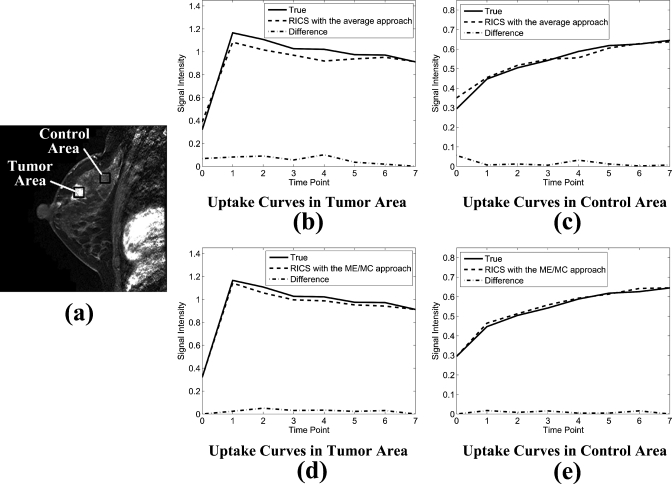
Figure 7.
Uptake curves reconstructed by RICS with the average and ME∕MC approaches. (a) A representative image showing the tumor and control area (indicated by the black squares) from which uptake curves were calculated. Each of these two areas contained 900 pixels. [(b) and (c)] The true uptake curves (solid line), uptake curves reconstructed by RICS with the average approach (dashed line), and the absolute difference between them (dotted-dashed line) from the tumor and control area, respectively. [(d) and (e)] The true uptake curves (solid line), uptake curves reconstructed by RICS with the ME∕MC approach (dashed line), and absolute difference between them (dotted-dashed line) from the tumor and control area, respectively.

