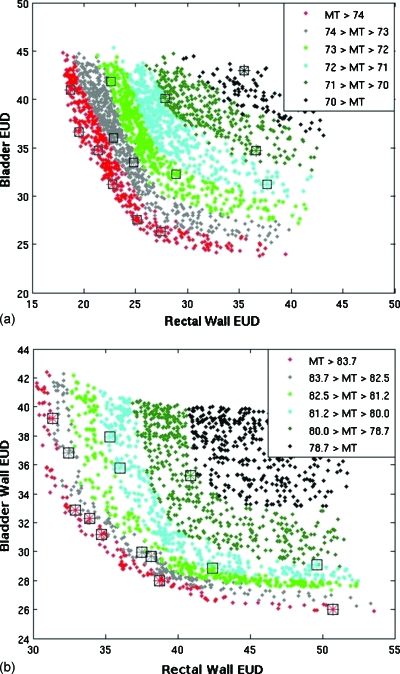
Figure 7.
Plots for short multiobjective optimizations mapped onto an approximation of the Pareto front for case 1 [top, (a)] and case 2 [bottom, (b)]. Rectum and bladder objective values are plotted with the target variance objective (MT) shown in color. The plans from the long optimization runs are represented as solid diamonds that make up most of the graphs. The plans resulting from the quick optimization are shown with asterisks using the same color scale and surrounded by a black square for easier viewing.

