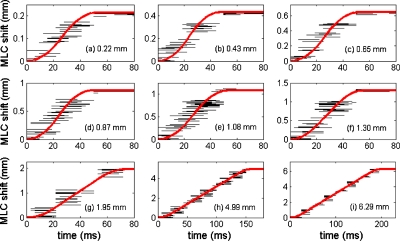
Figure 3.
Horizontal line segments in each subfigure: MLC aperture center shift for several tens of requested MLC adjustments of identical magnitude shown as a function of possible elapsed time interval since the adjustment was requested. Thick curves: Functional fit. For each graph, the requested adjustment magnitude is specified. [(a)–(f)] Results from 2 Hz kV-based tracking experiment. [(g)–(i)] Results from 1 Hz kV-based tracking experiment.

