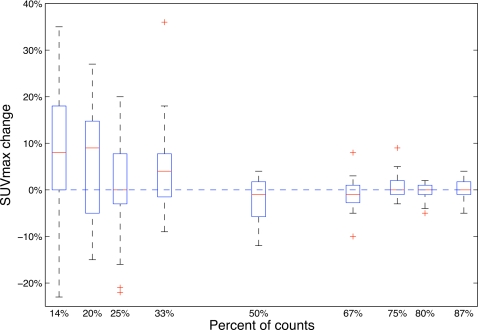
Figure 2.
SUVmax change as a function of fraction of counts for motion-blurred ungated patient data. The box stretches from the lower 25% quartile to the upper 75% quartile with a line across the box representing median. Whiskers extend from each end of the box to the most extreme values in the data within 1.5 times the interquartile range, which is defined as the difference between the upper quartile and the lower quartile, from each end of the box. Outliers with values beyond the ends of the whiskers are displayed with a + sign.

