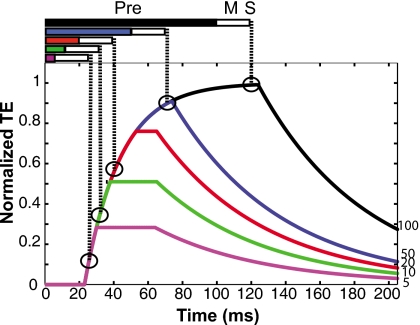
Figure 8.
Schematic depicting the MOCR model of predicted TE with different precursor durations. Bars above the figure panel represent precursors of different durations, followed by a 20-ms masker (open bar). The highlighted points in the figure show the predicted TE for the signal with each precursor duration in the minimum-delay condition. The maximum value in the model is normalized to each subject’s maximum TE.

