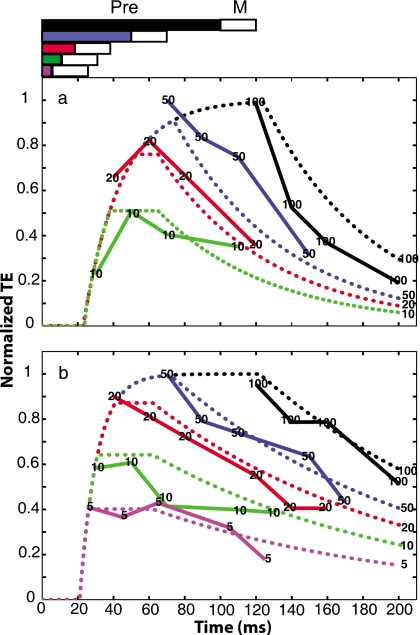
Figure 9.
(a) Data for S3 (number symbols and solid lines) and MOCR model predictions (dotted lines). Number symbols indicate the precursor duration. Numbers to the right of the dotted lines indicate the duration of precursor corresponding to the predicted effect size. For clarity, the 15-ms precursor condition was omitted from this figure. Bars above the figure panel show the temporal characteristics of the precursor and masker. (b) Data for S1 and the MOCR model predictions.

