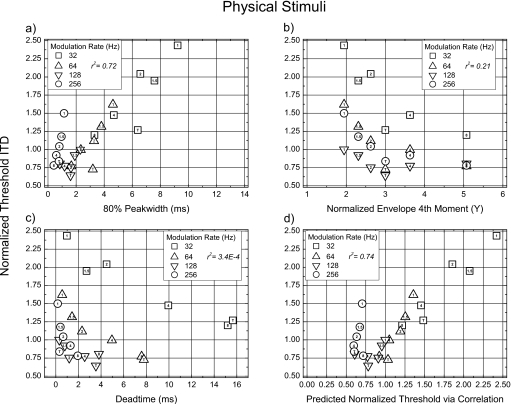
Figure 2.
Normalized threshold ITDs plotted as a function of the values of each of four candidate envelope measures computed on the physical stimuli (see text). The parameter in each plot is rate of modulation and the value of the exponent of the raised-sine is indicated within each symbol. Threshold ITDs obtained with transposed tones are identified by a “T” within the symbol. The relevant value of the coefficient of determination, r2, is given in each panel.

