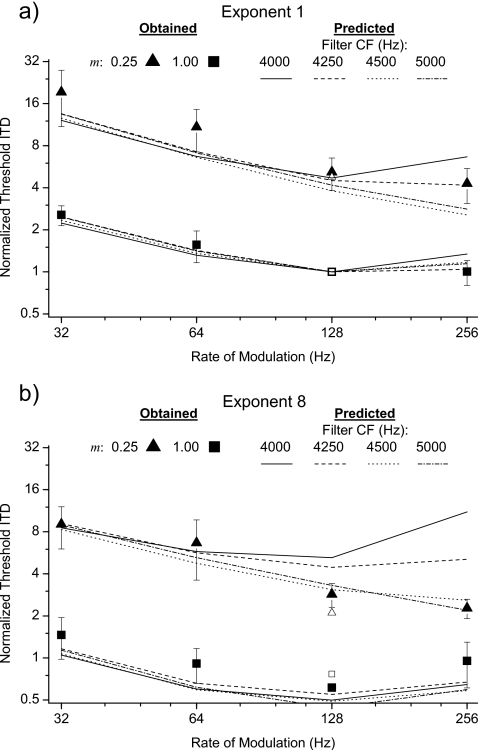
Figure 4.
Mean normalized threshold ITDs as a function of rate of modulation, for raised-sine exponents of 1.0 and 8.0, respectively. Closed triangles represent thresholds obtained when the depth of modulation was 25%; closed squares represent thresholds obtained when the depth of modulation was 100%. Error bars represent plus and minus one standard error of the mean. The open triangles and squares represent data from Bernstein and Trahiotis (2009) which were obtained with a rate of modulation of 128 Hz. Solid and broken lines represent predicted values of threshold computed via an interaural correlation-based model and while employing auditory filters centered at the frequencies indicated in the legends.

