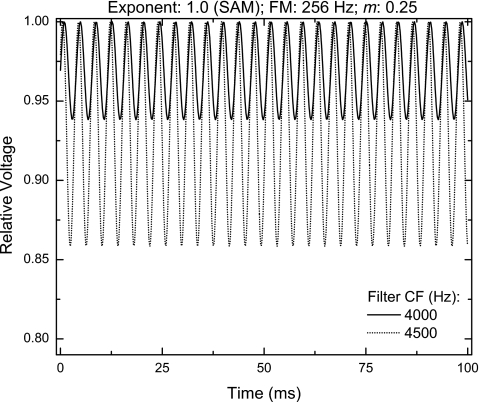
Figure 5.
Waveforms resulting from processing via the “front-end” of the normalized interaural correlation model (see text). The stimulus was a 4-kHz-centered raised-sine having an exponent of 1.0 (SAM tone) and modulated at 256 Hz. The solid line depicts the waveform resulting from centering the (gammatone) bandpass filter at 4000 Hz; the dotted line depicts the waveform resulting from centering the (gammatone) bandpass filter at 4500 Hz.

