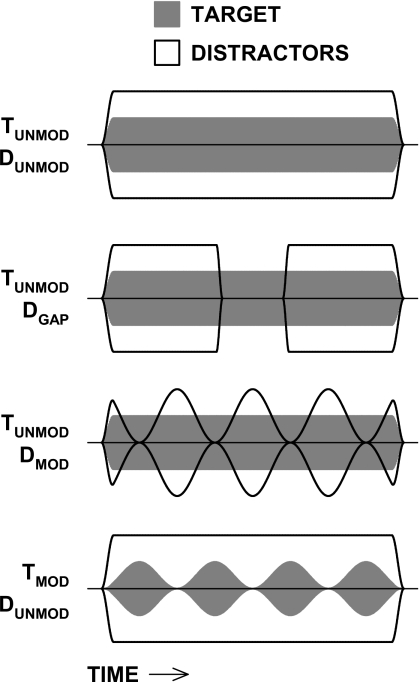
Figure 1.
A schematic illustration of the envelopes of the stimuli of Experiment 1. The envelope of the target is represented by the gray outline and the envelope of the distractors is represented by the black outline. The target carrier was a 753-Hz pure tone. The distractors prior to modulation were pure tones with frequencies of 553, 653, 853, and 953 Hz.

