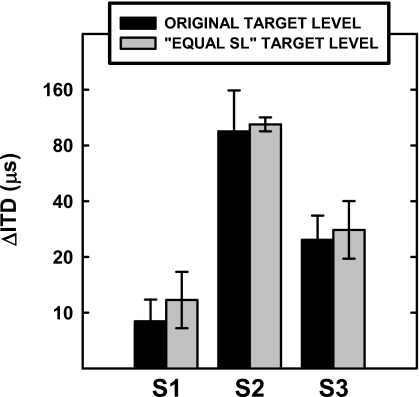
Figure 7.
The results of Experiment 4 for three individual listeners. Threshold ΔITDs for the target are plotted in μs on a log axis. Thresholds represented by the black bars were measured with the pure-tone target at 70 dB SPL. Thresholds represented by the gray bars were measured with the pure-tone target at the SPL that makes the target equally detectable to the unmodulated target in the presence of unmodulated distractors. The error bars represent standard deviations of the four threshold estimates for each individual listener.

