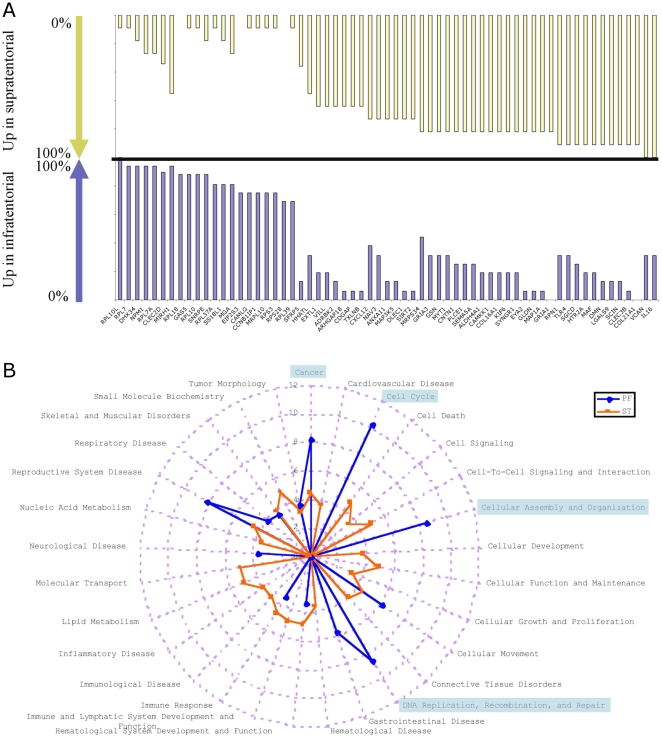
Figure 2. Comparison of functions associated with location of relapses.
A Gene most frequently upregulated at relapse for supratentorial (upper yellow panel) are represented with the genes most frequently upregulated in infratentorial tumors (lower blue panel). Bars indicated the percentage of tumors in each location with upregulation of the specific gene. B The -Log10(p-values) of the most discriminatory functions in each group are represented. The p-value for a given function was calculated using the right-tailed Fisher Exact Test by considering 1) the number of uploaded functional analysis molecules that participate in that function, and 2) the total number of molecules that are known to be associated with that function in Ingenuity's knowledge base.

