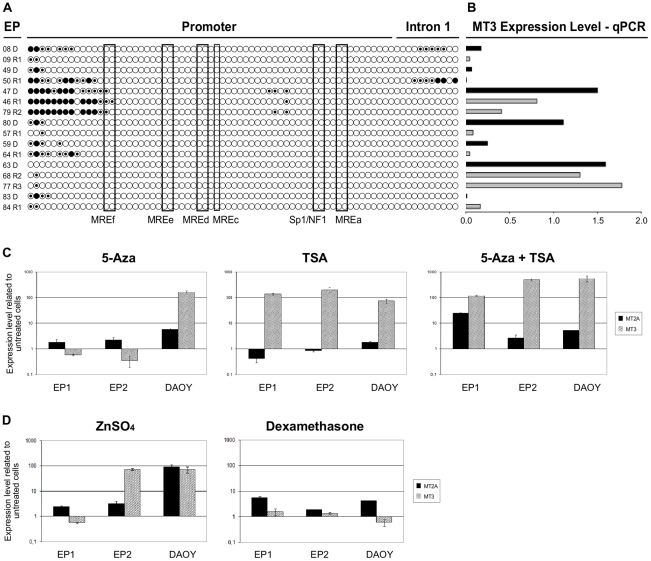
Figure 6. A: Methylation status of 74 CpG sites at MT3 promoter and intron 1.
Each row of circles represents one EP sample sequenced from PCR products generated from amplification of bisulfite-treated DNA. Empty circles = unmethylated cytosines; Dotted circles = hemimethylated cytosines; Dark circles = methylated citosines. B: MT3 expression analysis by quantitative PCR in the corresponding ependymoma tumors. Samples with results under 1.0 are downregulated and those over 1.0 are upregulated compared to normal brain. The black bars correspond to sample at diagnosis, and the grey bar to relapse. Each histogram represent the corresponding sample studied for methylation. C: Epigenetic modulation of MT2A and MT3 expression on short term ependymoma cultures EP1 and EP2 and medulloblastoma cell line DAOY as control. Demethylation by 5-Aza-Deoxycytidine (left panel). Histone deacetylation inhibition by Trichostatin A (middle panel). Combined treatments (right panel). D: Treatment with zinc sulfate restores the expression of MT3. MT2A and MT3 expression level after 24 hours of 200 mM of ZnSO4 (left panel) and 5 microM of dexamethasone (right panel) treatments in the ependymoma primary culture cells EP1 and EP2 and in the medulloblastoma cell line DAOY.

