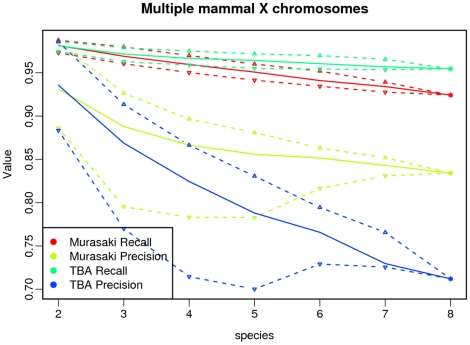
Figure 5. Ortholog consistency in multiple genome comparison.
This graph examines the consistency of anchors with known orthologs when comparing varying numbers of multiple mammalian X chromosomes (from 2 to 8 different species), using both Murasaki and TBA. Consistency is evaluated in terms of recall (the percent of known orthologs anchored), and precision (the percent of anchors incident on known orthologs to correctly include the other known orthologous set members). The solid line represents the median of all tests for that number of species, while the dashed lines represent the first and third quartiles. In this graph it can be seen that as the number of species increases, both precision and recall decline with both Murasaki and TBA, however Murasaki's precision remains significantly higher than TBA.

