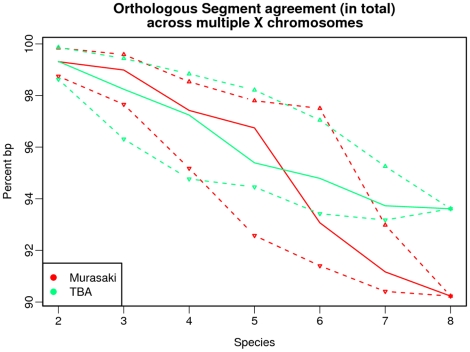
Figure 6. Orthologous segment agreement across multiple X chromosomes.
This graph shows the result of comparing othologous segments as identified by OSfinder using anchors from Murasaki and TBA. The quantities shown here are the percent of base pairs in each orthologous segment shared by the other. The solid line represents the median of all tests for that number of species, while the dashed lines represent the first and third quartiles. For example, with anchors generated from all 8 species, 94% of the base pairs in the orthologous segments generated from TBA's anchors were also identified as part of an overlapping orthologous segment by anchors from Murasaki.

