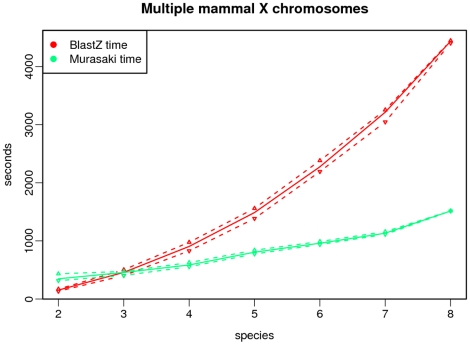
Figure 8. Computation time for multiple mammalian X chromosomes.
This graph compares the computational time required to compare multiple X mammalian X chromosomes using Murasaki and the BLASTZ component of TBA. Because TBA requires all pairwise comparisons of the genomes under alignment, the time required for TBA grows quadratically, while Murasaki's time is near linear. The solid line represents the median of all tests for that number of species, while the dashed lines represent the first and third quartiles.

