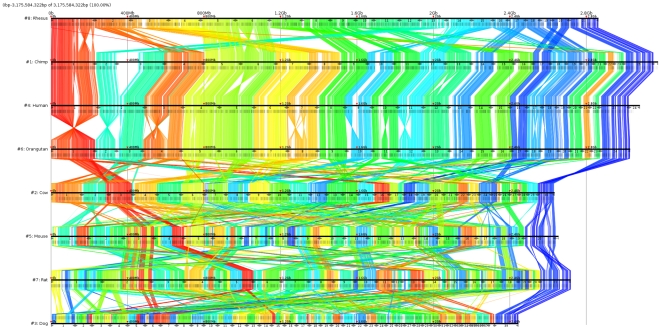
Figure 12. Anchors between 8 mammalian whole genomes.
This figure shows the resulting anchors from our comparison of 8 mammalian genomes (from top to bottom): rhesus, chimp, human, orangutan, cow, mouse, rat, and dog. Anchors are drawn as colored lines from one sequence to the next. The color is determined by the anchor's position in the first (rhesus) genome, making it easier to see rearrangements and where the other genomes are related. Chromosomes are denoted by the number shown between ▸ and ◂ symbols along each genome. The sex chromosomes are shown at the right end (e.g., 23 (X) and 24 (Y) for human).

