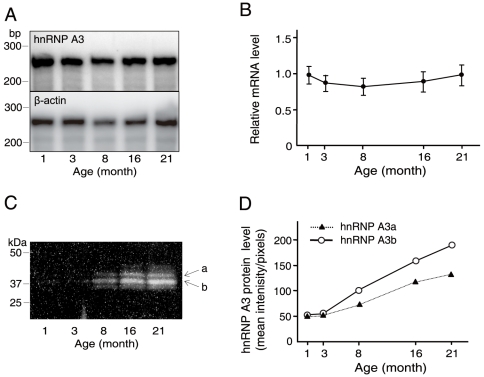
Figure 6. Age-dependent levels of hnRNP A3 mRNA and protein in the mouse liver.
A. Age-related changes of the hnRNP A3 mRNA level determined by RPA. Total liver RNA preparation obtained from male C57BL6/J mice (n = 4 per age point) was subjected to quantification by RPA. The top and bottom panels are for hnRNP A3 and β-actin, respectively. Numbers at the bottom of the panels represent age of animals. Size marker positions are shown on the left. B. The age-related profile of the relative hnRNP A3 mRNA level normalized to that of β-actin shown in A. C. Western blot analysis of age-related hnRNP A3 protein levels in the mouse liver. Protein size marker positions are shown on the left, and age of animals are shown at the bottom. Two major protein bands corresponding to the known isoforms, hnRNP A3a and hnRNP A3b, are depicted with a and b with arrows on the right. D. The age-related increase profiles of hnRNP A3a and hnRNP A3b proteins observed in C.

