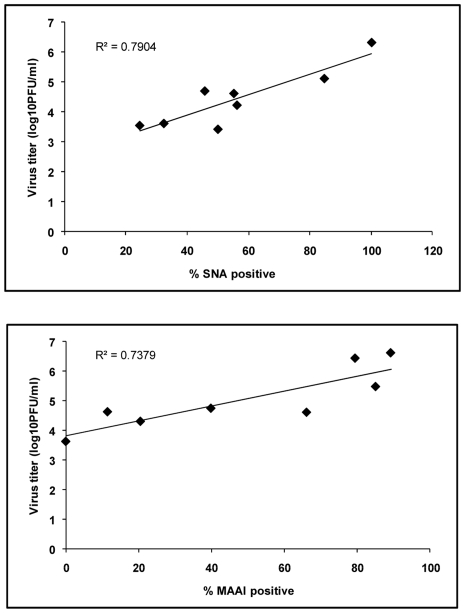
Figure 3. Correlation between the percentages of lectin-positive cells and the viral titers.
Dot plots of percentages of lectin-positive cells versus maximum viral titers produced from the same tissue samples show linear correlation with Pearson correlation coefficient of 0.889 for SNA (p = 0.003) and 0.859 for MAA I (p = 0.006). The data were derived from the same experiments shown in Figure 1, 2 and 4.

