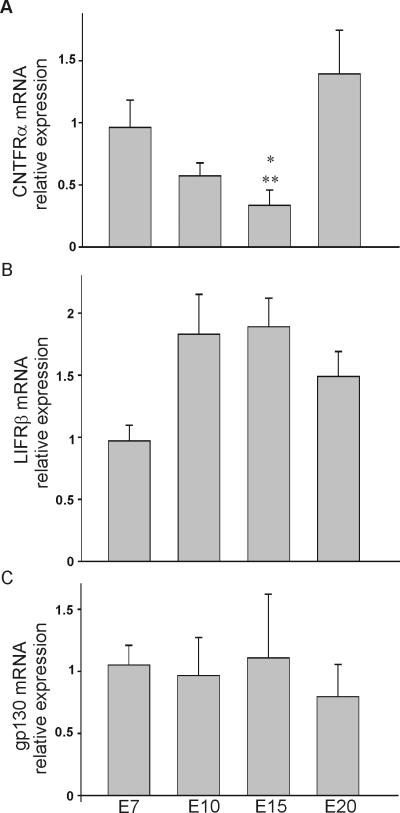
Figure 2.
Expression pattern of CNTFRα, LIFRβ and gp130 transcripts in chick nodose neurons. A, B, C) Relative expression of CNTFRα, LIFRβ and gp130 transcripts in chick nodose neurons as determined by real time PCR. Plots of the relative expression of CNTFRα, LIFRβ and gp130 mRNA as a function of age. * and ** denote p ≤ 0.05 vs. E7 and E20, respectively.

