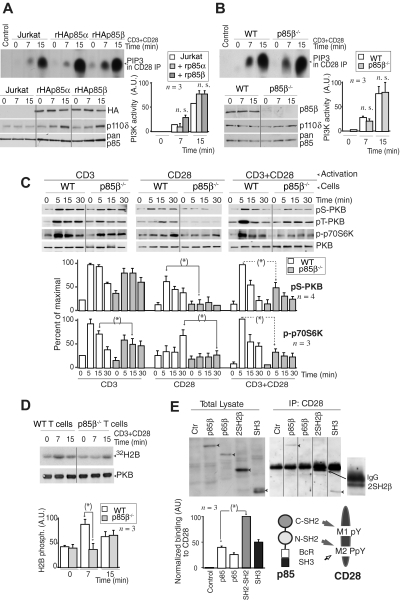
Figure 2.
Lower PKB activation in p85β-deficient cells. (A,B) Jurkat cells were transfected with control, rHAp85α, or rHAp85β in combination with p110δ vectors and incubated for 36 hours (A). T cells were purified from Wild-type (WT) and p85β−/− and mice (B). Cells were activated with CD3 + CD28 antibodies (7 or 15 minutes) and collected. PI3K activity was assayed in CD28 immunoprecipitates in vitro. WB examined recombinant protein expression levels in cell extracts. The histogram represents the mean plus or minus SD (n = 3) of the PIP3 signal in AUs. (C,D) T cells were purified from p85β−/− and p85β+/− spleen and lymph node cell suspensions, then activated by CD3, CD28, or CD3+CD28 cross-linking (indicated). (C) Total cell lysates were examined in WB using anti–pSer473-PKB, anti–pThr308-PKB, anti–pThr389-p70S6K, or anti-PKB antibodies. Graphs show the percentage of p-PKB or p-p70S6K signal compared with maximal (with CD3+CD28 at 5 minutes). (D) PKB was immunoprecipitated from cell extracts and assayed in vitro using histone H2B as substrate. Graphs were as in panel A. (E) Jurkat cells were transfected with cDNA encoding the indicated p85β mutant forms, and 36 hours later cells were activated as in panel A, and total extracts or CD28 immunoprecipitates resolved by SDS-PAGE and examined by WB using anti-HA Ab. Vertical lines have been inserted to indicate a repositioned gel lane. The graph shows the mean signal plus or minus SD (AUs) of CD28-bound rp85β forms normalized for their expression levels. Scheme showing the potential interaction domains of p85 and CD28 and after activation. *P < .05.

