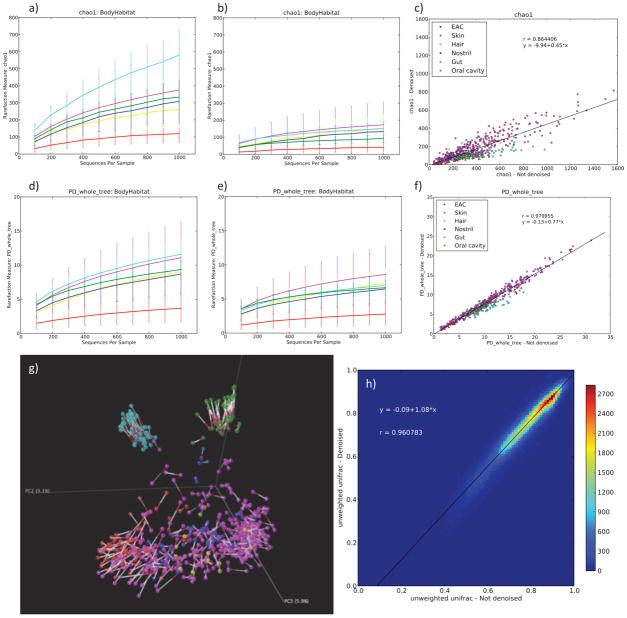
Figure 1.
Comparisons of non-denoised data (a–c) to denoised data (d–f) for alpha diversity for the Body Habitat study, and comparisons of beta diversity (g–h). Rarefaction plots of the “Body Habitat” study4 show a 3 to 4 fold decrease in the Chao1 estimate when comparing non-denoised (a) to denoised (b) data. Interestingly, denoising changes the relative order of OTU richness of individual body habitats: the gut exhibits the highest OTU richness without denoising, but falls back into the middle ranks after denoising. This holds true for both Chao1 estimates and phylogenetic diversity (PD). c) Scatter plots of alpha diversity metrics per sample show a high correlation overall, but a significant deviation from the average for gut and the oral cavity. (EAC = external auditory canal). g) Procrustes analysis of denoised and filtered unweighted UniFrac principal coordinates analysis (PCoA). Bars connect identical samples in the plot with the red side of the bar pointing towards the denoised data. There is no qualitative difference between denoised and filtered in the overall clustering, yet on a smaller scale we observe that the denoised samples are oriented more to the center than the filtered ones. This shows that denoising removes some of the artificial distance between samples introduced by false OTUs. h) Unweighted UniFrac distances for all pairs of samples for the denoised and filtered data set are highly correlated (r2=0.96). From the regression, it is clear that for similar samples noise has a greater effect than it has for dissimilar samples. The color bar gives the number of pairwise comparisons at a particular point.

