Figure 5.
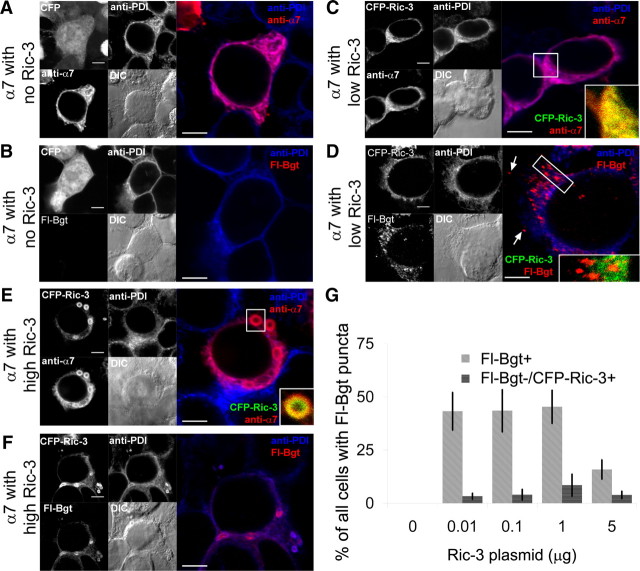
Cellular localization of Ric-3 and α7 subunits. A–F, As in Figure 2, cells expressing α7 subunits and no Ric-3 (A, B), low levels of Ric-3 (C, D), and high levels of Ric-3 (E, F) were sorted. Images of typical cells are displayed for the different levels of Ric-3. The left half of each panel is divided into four sections. Upper left, The CFP fluor used for sorting; upper right, the ER marker (anti-PDI Ab); lower left; the α7 subunit-specific marker (anti-α7 Ab or Fl-Bgt); lower right, the DIC image. On the right half are merged images of the upper right and lower left quarters of the left half. A, Cells were stained for α7 subunits and the ER. B, Cells were stained for intracellular BgtRs and the ER. C, Cells were stained for α7 subunits and the ER. A higher magnification of the boxed region in the merged image is displayed in the inset and is a merged image of the CFP-Ric-3 and anti-α7 Ab fluorescence. D, Cells were stained for intracellular BgtRs and the ER. With low Ric-3 levels, we observed bright puncta stained with Fl-Bgt. A higher magnification of the puncta in the boxed region in the merged image is displayed in the inset and is a merged image of the CFP-Ric-3 and Fl-Bgt fluorescence. E, Cells were stained for α7 subunits and the ER marker. With high Ric-3 levels, we observed Ric-3 aggregates stained with anti-α7 and Fl-Bgt. A higher magnification of the boxed region in the merged image is displayed in the inset and is a merged image of the CFP-Ric-3 and anti-α7 Ab fluorescence. F, Cells were stained for intracellular BgtRs and the ER. G, Cells were sorted and stained as in D or F and we determined the percentage of sorted cells that had four or more Fl-Bgt-stained puncta. On the y axis, we plotted the percentage of total cells with four or more Fl-Bgt-stained puncta at the indicated levels of Ric-3 for cells sorted for Fl-Bgt fluorescence (Fl-Bgt+) or for cells lacking Fl-Bgt fluorescence but positive for CFP-Ric-3 fluorescence (Fl-Bgt−/CFP-Ric-3+). Scale bars, 5 μm.

