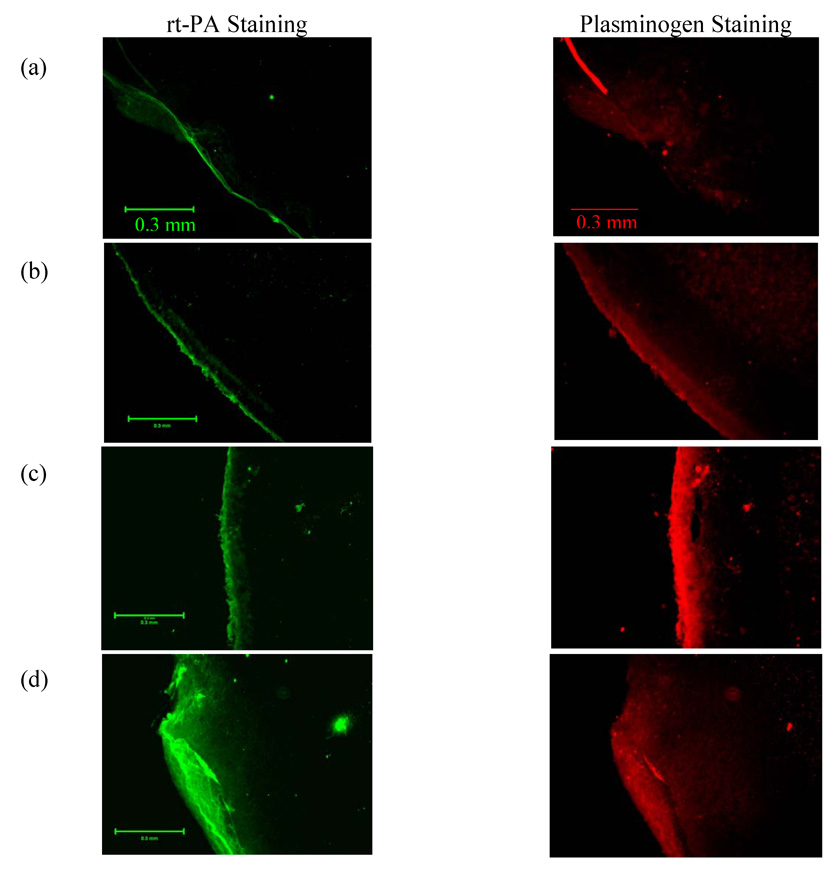
Figure 8.
Representative examples of fluorescent dual antibody stained images of clot sections. The left column images are stained green for rt-PA by fluorescien isothiocynate (FITC) conjugated secondary antibody. For the same section the right column images show accumulation of plasminogen stained red by Texas red (TRITC) conjugated secondary antibody. Representative clot section images are shown for a) no rt-PA, Definity® or US (the control treatment), b) rt-PA alone treatment, c) rt-PA, PBS infusions and US (0.32 MPa peak-to-peak amplitude) treatment and d) rt-PA, Definity® infusions and US (0.32 MPa peak-to-peak amplitude) treatment.

