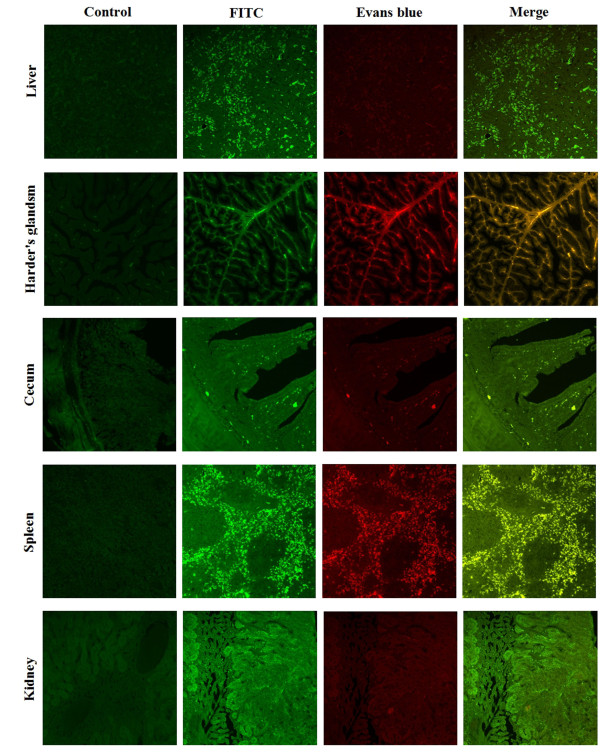
Figure 3.
Indirect immunofluorescent microscopy was used to monitor the DEV antigen distribution in liver, harder's glands, cecum, spleen and kidney of the infected ducks. The tissue sections were made at 4 μm and stained with an indirect immunofluorescent technique. Images were photographed by using 20× objective. Labels on the left side of this figure indicate different organs from ducks. Negative control is shown in the left of the figure, and the staining methods are indicated above the top horizontal row.

