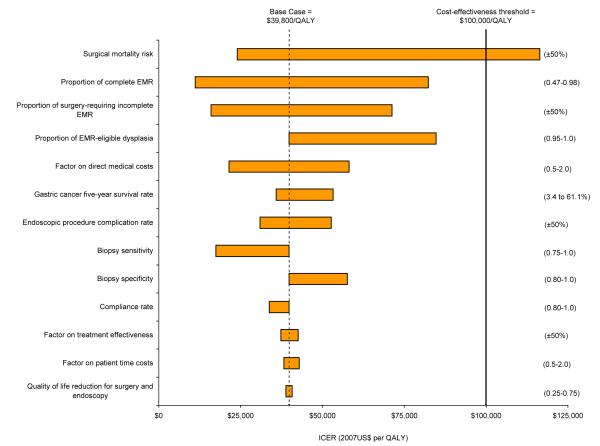
Figure 3. Sensitivity analysis on select variables for gastric dysplasia.
Graph depicts univariate sensitivity analyses for EMR with surveillance every 1 year. Values in parentheses indicate upper and lower bounds for each variable. The vertical dashed line indicates the incremental cost-effectiveness ratio for the base case. Bold line represents the commonly used $100,000 per QALY cost-effectiveness threshold.

