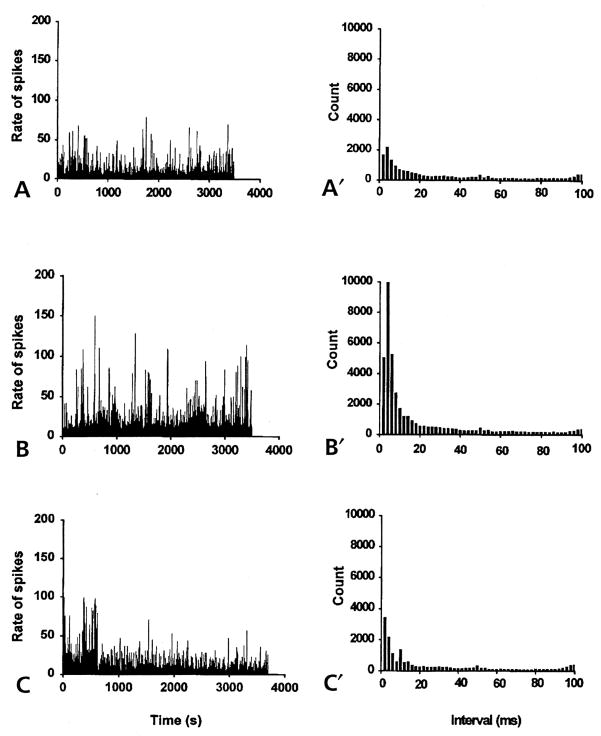
Figure 5.
The spike rate histograms (left) and the interspike interval histograms (right) constructed from spontaneous antidromic action potentials recorded from the MAN of noninflamed rats (bin width, 1 second). (A) Spike-like background activity was recorded from the MAN during microdialysis infusion of aCSF into the spinal cord for about 1 hour. The irregular, antidromic, multi-unit activity had a mean firing rate of 8/sec. Interspike interval histogram (A′) showed the number of counts at each interval with the peak interval at 4 milliseconds. (B) Spinal microdialysis administration of 4-AP (at the concentration of about 27.7 μmol/L for 1 hour) the frequency of spike activity was greatly increased with a mean firing rate of 26/sec. (B′) The peak interspike interval at 4 milliseconds increased in magnitude to about 5 times that of the aCSF control (A′). (C) and (C′) Microdialysis coinfusion of 4-AP and AIDA (17 μmol/L) for about 1 hour reversed the effect of 4-AP. The mean firing rate decreased to the level of the aCSF control (8.29/sec). The interspike interval histogram (C′) returned to the control level.

