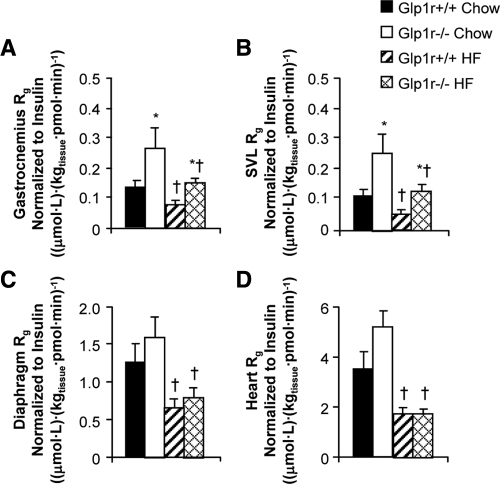
Figure 4.
Glucose metabolic index (Rg) in gastrocnemius (A), superficial vastus lateralis (B), diaphragm (C), and heart (D) during insulin clamps. Shown are results for chow-fed Glp1r+/+ (black bars), chow-fed Glp1r−/− (white bars), HF-fed Glp1r+/+ (striped bars) and HF-fed Glp1r−/− (diamond pattern bars) mice. Values for Rg are normalized to clamp insulin levels. Data are shown as mean ± sem for 8–10 mice/genotype and diet. *P < 0.05 vs. Glp1r+/+, same diet; †P < 0.05 vs. Chow, same genotype.

