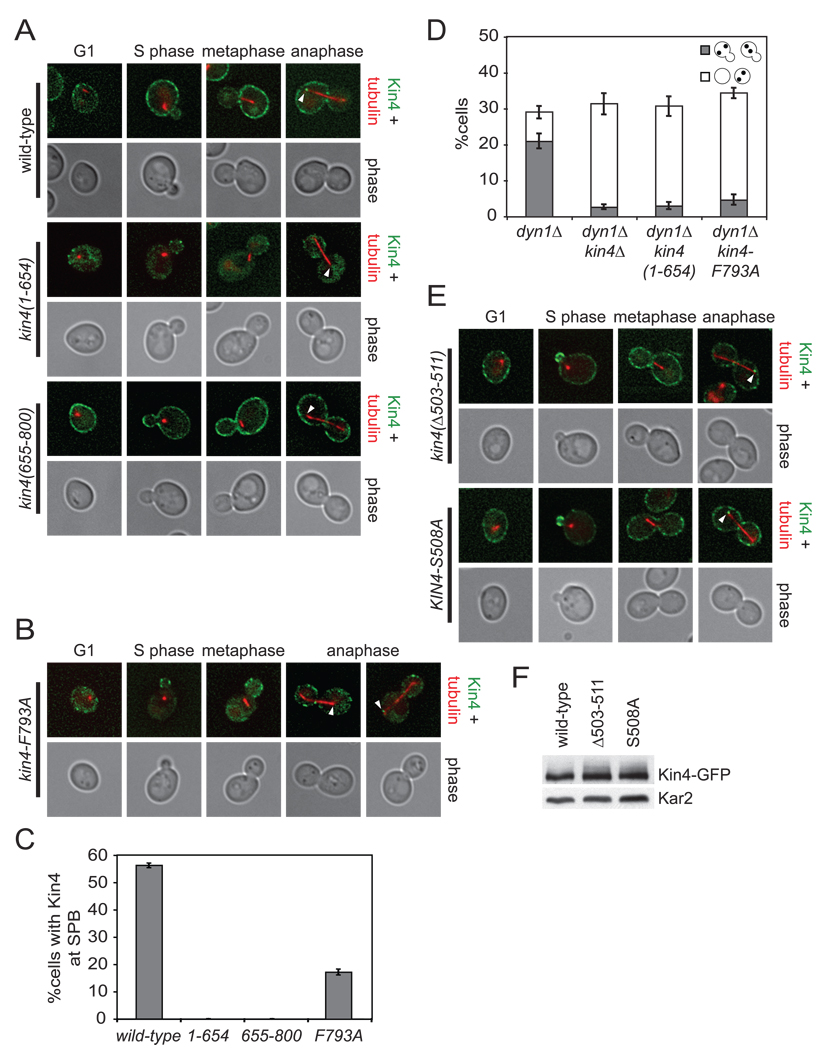
Figure 3. Sequences in the C-terminus of Kin4 control asymmetric cortical localization.
(A) Cells expressing an mCherry-Tub1 fusion protein and Kin4-GFP (A19900) or kin4(1–654)-GFP (A21575) or kin4(655–800)-GFP (A21576) were grown to exponential phase and imaged live. The deconvolved GFP signal shown is from 8–10 serial sections. Kin4-GFP is shown in green, mCherry-Tub1 in red. Arrowheads indicate the position of the mother SPB.
(B) Cells expressing kin4-F793A-GFP and mCherry-Tub1 (A21556) were analyzed as in (A).
(C) Cells from (A) and (B) were analyzed over a single cell cycle as described in Figure 1B. Samples were taken at 60, 75, 90 and 105 minutes post release and imaged live. Serial sections spanning the entire cell were collected to ensure imaging of all spindle poles. Loading of Kin4 to the SPBs was judged by co-localization of Kin4-GFP with the ends of the anaphase spindle. n ≥ 100 cells and error bars represent SEM.
(D) dyn1Δ (A17349), dyn1Δ kin4Δ (A17351), dyn1Δ kin4(1–654) (A22263) and dyn1Δ kin4-F793A (A21298) were analyzed as in Figure 2C.
(E) Cells expressing mCherry-Tub1 and kin4(Δ503–511)-GFP (A21555) or Kin4-S508A (A21557) were analyzed as in (A).
(F) Cells expressing mCherry-Tub1 and Kin4-GFP (A19900), kin4(Δ503–511)-GFP (A21555) or Kin4-S508A-GFP (A21557) were lysed and analyzed for expression of the Kin4 fusion protein by western blot analysis. Kar2 was used as a loading control.

