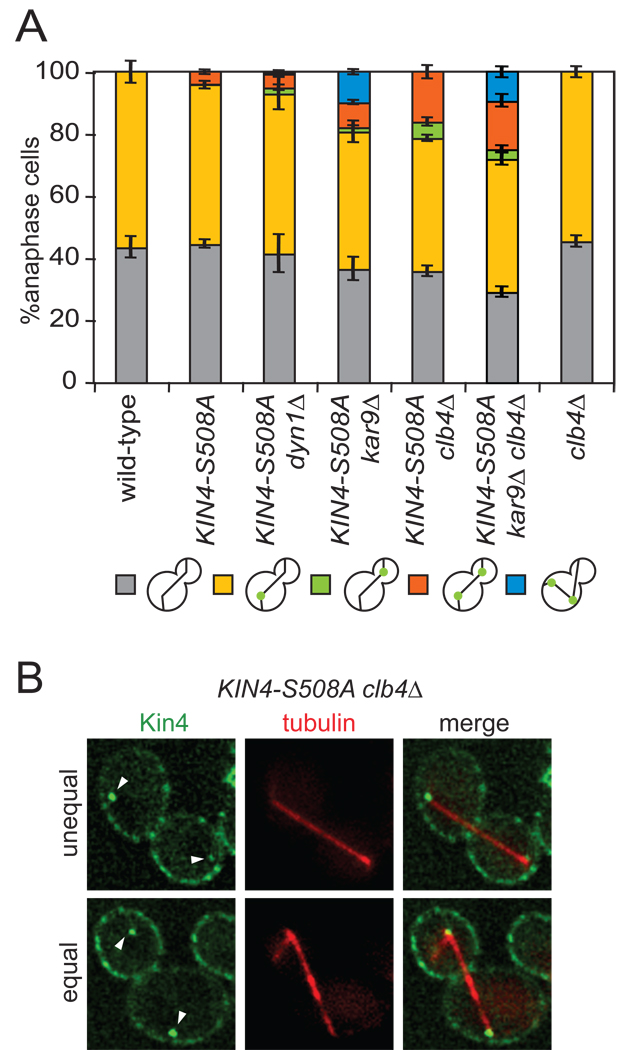
Figure 5. Kar9 and Clb4 prevent symmetric Kin4 from loading to the daughter SPB.
(A) Cells expressing GFP tagged Kin4 and mCherry-Tub1 with the following genetic backgrounds: wild-type (A19900), KIN4-S508A (A21557), KIN4-S508A dyn1Δ (A23052), KIN4-S508A kar9Δ (A23051), KIN4-S508A clb4Δ (A23055), KIN4-S508A clb4Δ kar9Δ (A25794) and clb4Δ (A23249) were analyzed as in Figure 3C. n ≥ 100 cells and error bars represent SEM.
(B) Representative KIN4-S508A clb4Δ cells with symmetric Kin4 localization to the SPBs. The top cell shows an unequal SPB loading pattern whereas the bottom cells shows equal Kin4-GFP intensity at both SPBs. The deconvolved GFP signal shown is from 10 serial sections.

