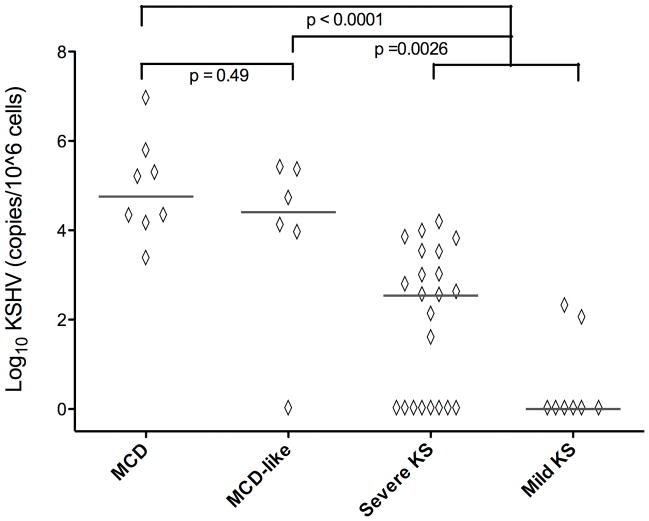
Figure 2. Comparisons of KSHV Viral Load between MCD, MCD-like and KS Control Groups.
Comparisons of PBMC-associated KSHV viral load between MCD (n=8) MCD-like (n=6) Severe KS (n= 22) and Mild KS (n=8) groups were performed using an exact form of the Wilcoxon rank-sum test. Values are log10 transformed copies/106 cells, p- values are two-sided. ----------- = median.

